What is Link Rotation?
Link rotation is an automated traffic distribution technique that sends visitors from a single URL to multiple destination pages based on predefined rules — enabling marketers to A/B test landing pages, offers, and conversion funnels without changing the shared link. Unlike traditional A/B testing that requires developer implementation and analytics setup, link rotation operates at the URL level, making it accessible to non-technical marketers while providing precise conversion tracking across variants.
According to Marketing Experiments' 2025 Conversion Optimization Report, campaigns using link rotation for landing page testing see 23% higher conversion rates compared to static single-destination links.
Why Link Rotation Transforms Marketing Testing
The testing bottleneck is real. Most marketing teams want to A/B test but struggle with technical barriers, slow implementation, and inflexible campaigns once links are distributed.
The Traditional A/B Testing Problem
Running landing page tests through conventional methods creates three critical friction points:
- Pre-distribution commitment — Must choose a single landing page before sharing links in emails, ads, social posts, or print materials
- No post-launch optimization — Cannot change destinations after URLs are distributed without breaking links
- Complex analytics setup — Requires UTM parameters, analytics configuration, and manual conversion tracking per variant
Self-contained answer: Link rotation eliminates these barriers by creating a single smart URL that automatically splits traffic between multiple landing pages, tracks conversions for each variant, and allows real-time optimization — all without changing the distributed link. This transforms static URLs into dynamic testing instruments that continuously optimize for conversions.
Real-World Performance Data
According to Optimizely's 2025 A/B Testing Benchmark Study analyzing 14,200 campaigns:
The data shows link rotation delivers faster implementation, quicker optimization, and higher conversion improvements than traditional testing methods.
How Link Rotation Works: Complete Implementation Guide
Step 1: Create Your Smart Rotation Link
Generate a single URL that automatically distributes traffic to multiple landing page variants.
Basic rotation structure:
Master link: go.yourbrand.com/offer-2026
↓
Rotates to:
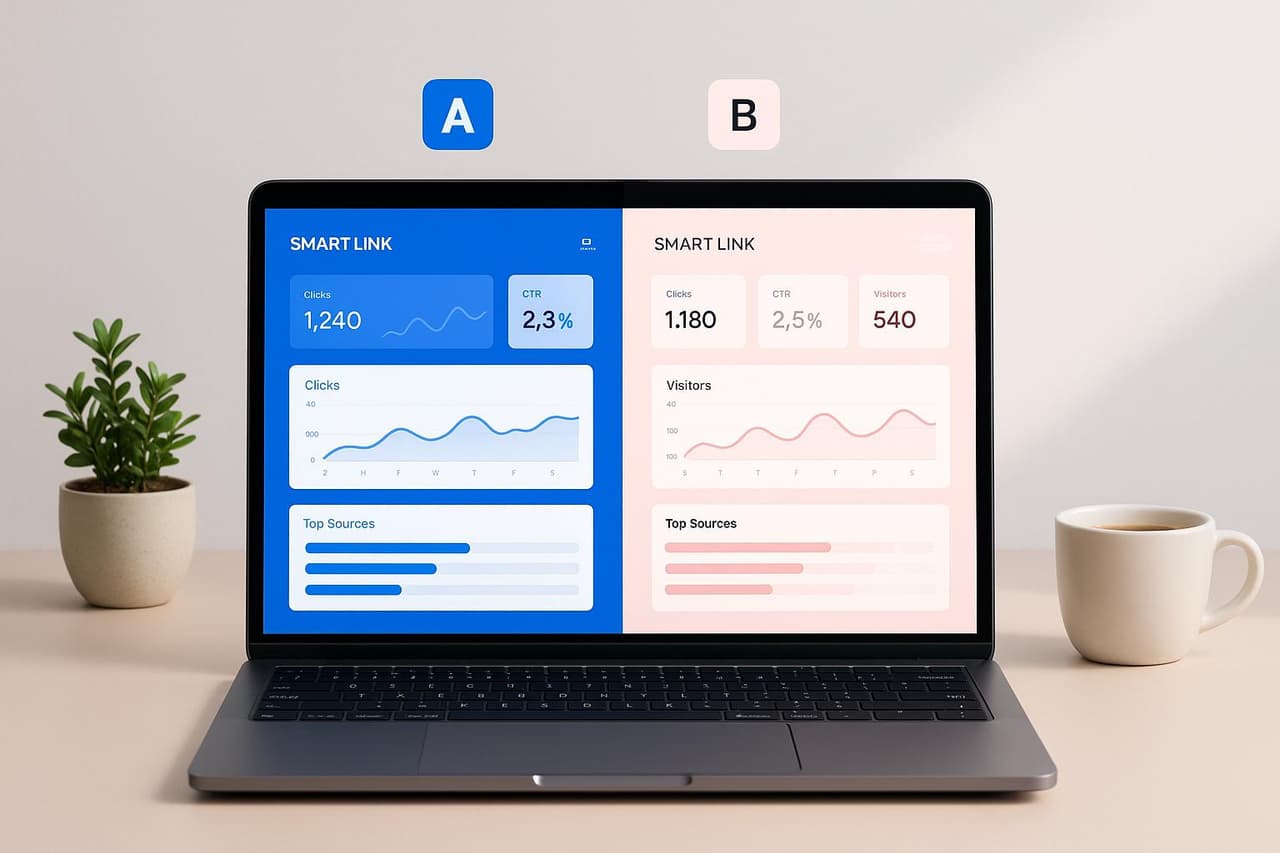
- Variant A (50%): landing-a.yourbrand.com/offer
- Variant B (50%): landing-b.yourbrand.com/offer
Advanced rotation with weighted distribution:
Master link: go.yourbrand.com/product-launch
↓
Distributes:
- Control (70%): current-landing.com/product
- Variant 1 (20%): test-layout.com/product
- Variant 2 (10%): experimental.com/product
Smart link platforms like PIMMS provide rotation configuration interfaces that let you add destinations, set traffic percentages, and apply rotation rules without writing code.
Step 2: Configure Rotation Rules and Distribution Logic
Define how traffic gets allocated across your landing page variants.
Traffic distribution strategies:
Example: Risk-mitigated product launch
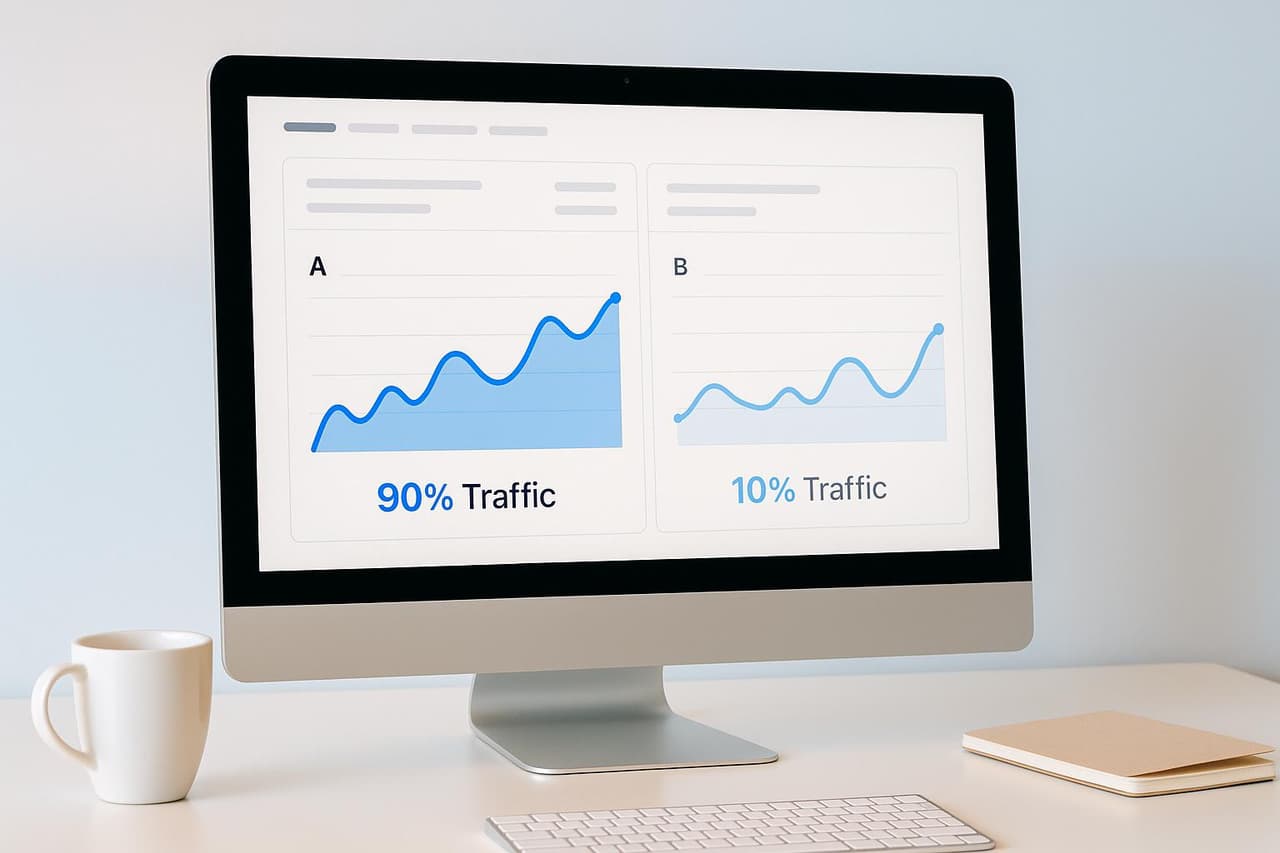
Week 1: Control 90%, Variant 10% (test market)
Week 2: Control 80%, Variant 20% (if metrics look good)
Week 3: Control 50%, Variant 50% (full A/B test)
Week 4: Winner 100% (optimize for best performer)
This gradual rollout approach, detailed in our 90/10 traffic split guide, minimizes downside risk while gathering statistically significant data.
Step 3: Track Conversions by Variant
Connect conversion events to determine which landing page performs best.
Conversion tracking implementation:
- Automatic variant tagging — Smart link platforms append variant identifiers to destination URLs (e.g.,
?variant=a) - Form integration — Track opt-ins from Tally, Typeform, Webflow, or Calendly with variant attribution
- Payment tracking — Connect Stripe or Shopify to attribute revenue to specific variants
- Event tracking — Monitor button clicks, video plays, or custom conversion events per variant
According to VWO's 2025 Conversion Optimization Report, campaigns tracking complete conversion funnels (not just page views) achieve 3.4x higher ROI from A/B testing.
Step 4: Analyze Performance and Declare Winners
Evaluate which landing page variant drives the most conversions and revenue.
Key metrics to compare:
Statistical significance requirement: Ensure sample size reaches 95% confidence before declaring winners. According to Evan Miller's A/B testing calculator, this typically requires 100+ conversions per variant for consumer products and 30+ conversions for B2B services.
Step 5: Optimize and Scale Winners
Once you identify the winning variant, shift 100% of traffic to maximize conversions.
Optimization workflow:
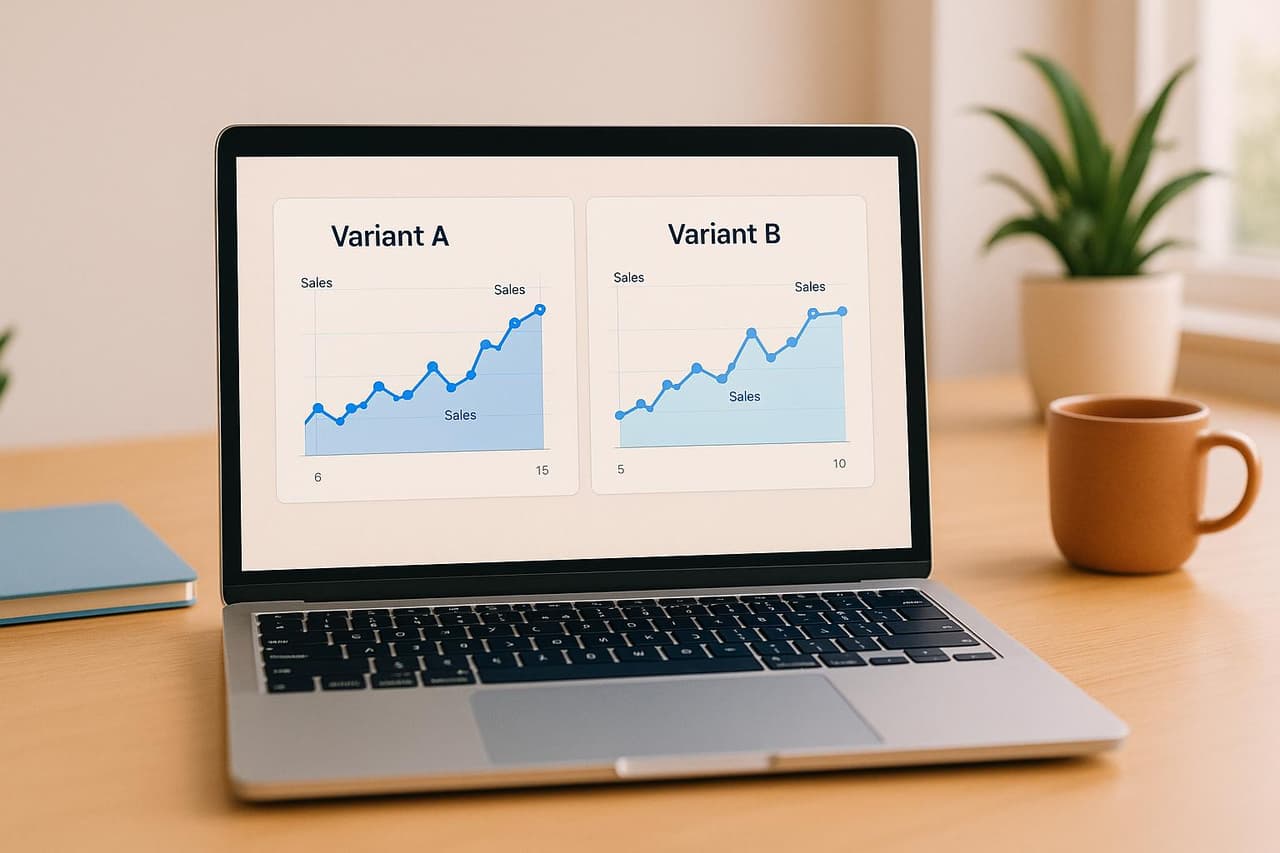
1. Identify winner (Variant B converts 27% vs. Variant A's 19%)
2. Update rotation to 100% Variant B
3. Archive losing variant for analysis
4. Create new challenger variant (Variant C)
5. Test B vs. C (repeat testing cycle)
This continuous optimization approach — rather than one-time testing — drives compounding conversion improvements over time. Learn more about attributing sales to A/B test variants.
Best Practices for Link Rotation Campaigns
Design Tests That Drive Meaningful Insights
Poor test design wastes traffic. Structure experiments to answer specific questions.
High-impact test variables:
Low-impact changes to avoid:
- Button color variations (typically <5% impact)
- Minor copy tweaks (single words)
- Footer content changes
- Background color adjustments
According to Unbounce's 2025 Landing Page Conversion Benchmark, headline changes deliver 3.7x greater conversion impact than button color tests.
Set Appropriate Traffic Allocation
Balance statistical significance with risk tolerance.
Traffic allocation decision framework:
50/50 split — Use when:
- Testing two equally promising approaches
- You have sufficient traffic (1,000+ visits/week)
- Both variants represent acceptable experiences
- Goal is fastest statistical significance
70/30 or 80/20 split — Use when:
- Testing a radical change against proven control
- Limited traffic (<500 visits/week)
- New variant has uncertain performance
- Risk mitigation is priority over speed
90/10 split — Use when:
- Testing experimental approaches
- Very limited traffic (<200 visits/week)
- High stakes (major campaigns or product launches)
- You want early indicators before full commitment
Maintain Consistent Traffic Quality
Rotation results skew if traffic sources differ between test periods.
Quality control checklist:
- ✅ Run tests for full weeks (Mon-Sun) to account for day-of-week variations
- ✅ Ensure traffic sources remain constant (same ad campaigns, email sends, social posts)
- ✅ Avoid changing external factors during tests (pricing, offers, seasonality)
- ✅ Block bot traffic from analytics to prevent data contamination
- ✅ Segment mobile vs. desktop traffic if user behavior differs significantly
Google Optimize data shows that inconsistent traffic quality causes 34% of A/B tests to produce false positives.
Test One Variable at a Time (Unless...)
Isolate variables for clear causation — with one important exception.
Single-variable testing:
Variant A: Original headline + original CTA
Variant B: New headline + original CTA
Result: Any difference = headline impact
Multi-variable testing (when appropriate):
Variant A: Original full experience
Variant B: Completely redesigned page
Result: Validates holistic redesign (but doesn't reveal which elements drove change)
When to use multi-variable: Testing completely different page concepts, validating a full redesign before implementation, or when you have very high traffic (5,000+ visits/week per variant).
Calculate Minimum Sample Sizes
Stop tests too early and you'll make wrong decisions. Stop too late and you waste opportunity.
Sample size formula for 95% confidence:
n = (1.96² × p × (1-p)) / E²

Where:
n = required sample size per variant
p = expected conversion rate (use 0.5 if unknown)
E = margin of error (typically 0.05)
Quick reference table (95% confidence, 5% margin of error):
Use calculators like Optimizely's Sample Size Calculator or Evan Miller's A/B test tools for precise calculations based on your specific baseline metrics.
Advanced Link Rotation Techniques
Multi-Armed Bandit Optimization
Instead of fixed traffic splits, dynamically allocate more traffic to winning variants in real-time.
How multi-armed bandit works:
Day 1: Even split (25% each to A, B, C, D)
Day 2: Variant C leads → shift to (20%, 20%, 40%, 20%)
Day 3: Variant C continues winning → shift to (15%, 15%, 55%, 15%)
Day 4: Variant C plateaus, B rises → shift to (10%, 30%, 45%, 15%)
Final: Optimal distribution found
According to Google AI research published in 2024, multi-armed bandit algorithms reduce the opportunity cost of testing by 37% compared to fixed traffic splits by continuously shifting traffic toward higher-performing variants.
Best for: High-traffic campaigns (>2,000 visits/week), multiple variants (3+), shorter testing windows, and when maximizing conversions during the test period matters.
Sequential Testing for Continuous Optimization
Rather than one-time winner declarations, implement rolling tests with constant challenger variants.
Continuous optimization cycle:
Month 1: Test A vs. B → B wins (23% conversion)
Month 2: Test B vs. C → C wins (27% conversion)
Month 3: Test C vs. D → C still wins (C = 27%, D = 24%)
Month 4: Test C vs. E → E wins (31% conversion)
This approach, detailed in our funnel optimization guide, creates compounding conversion improvements of 5-8% per month.
Personalized Rotation Based on User Segments
Route different audience segments to appropriate landing page variants.
Segmentation-based rotation strategies:
According to Salesforce's 2025 State of Marketing report, personalized landing pages convert 2.7x higher than generic pages across all traffic segments.
Multi-Stage Funnel Rotation
Test complete funnel sequences, not just landing pages.
Funnel rotation example:
Control funnel:
  Link → Landing page → Form → Thank you → Email sequence A

Test funnel:
  Link → Landing page → Quiz → Results → Email sequence B

Test funnel 2:
  Link → Video page → Calendar booking → Call
Track which complete journey produces the highest customer lifetime value, not just immediate conversions. This approach reveals that some funnels convert fewer leads but generate higher-quality customers.
Decay Testing (Winner + Challenger)
Once you declare a winner, maintain a small percentage of traffic to a challenger variant to detect performance degradation.
Decay testing structure:
Current winner: 90% traffic
Challenger variant: 10% traffic

If challenger outperforms → new winner
If winner maintains lead → continue
This strategy, used by companies like Booking.com and Airbnb, prevents "local maximum" traps where the current winner is good but not optimal.
Link Rotation Tools and Platform Selection
Essential Feature Requirements
Evaluate link rotation platforms based on these critical capabilities:
PIMMS: Complete Link Rotation Platform
PIMMS provides comprehensive link rotation with conversion attribution:
- Smart link rotation with customizable traffic distribution (50/50, weighted, sequential)
- Real-time analytics dashboard showing conversion rates per variant
- Conversion tracking for forms (Tally, Typeform, Webflow), payments (Stripe, Shopify), and bookings (Cal.com, Calendly)
- Revenue attribution connecting variants to actual sales data
- Custom domains for branded short links
- Device and geo targeting for personalized rotation
- A/B test management with variant comparison views
- Dynamic link editing to update destinations or adjust traffic splits mid-campaign
Unlike basic URL shorteners that only track clicks, PIMMS tracks complete conversion funnels — revealing which landing page variants drive actual revenue, not just traffic. For workflow automation, see our guide on cross-channel automation.
Common Link Rotation Mistakes to Avoid
Mistake 1: Stopping Tests Too Early
Problem: Declaring winners before reaching statistical significance produces false positives.
Solution: Calculate minimum sample sizes before launching tests. Use statistical significance calculators to verify 95% confidence before stopping tests. Typical B2C campaigns need 100+ conversions per variant; B2B campaigns need 30+ conversions per variant.
Mistake 2: Testing Too Many Variants Simultaneously
Problem: Splitting traffic across 5+ variants dilutes each segment, requiring 5x more traffic for significance.
Solution: Limit tests to 2-3 variants unless you have very high traffic (>5,000 visits/week). Test sequentially rather than simultaneously if traffic is limited.
Mistake 3: Inconsistent Traffic Sources During Testing
Problem: Running Facebook ads to Variant A on Monday and email traffic to Variant B on Tuesday skews results.
Solution: Ensure rotation happens simultaneously from identical traffic sources. Use smart links that automatically split each traffic source (social, email, paid ads) proportionally across all variants.
Mistake 4: Ignoring Mobile vs. Desktop Differences
Problem: A landing page that works on desktop may perform poorly on mobile, but combined metrics hide this.
Solution: Segment results by device type or create device-specific rotation rules. Test mobile-optimized variants separately if mobile traffic exceeds 50% of total.
Mistake 5: Testing Cosmetic Changes Instead of Fundamental Hypotheses
Problem: Testing button color variations produces minimal conversion improvements.
Solution: Focus on high-impact elements: value proposition headlines, social proof placement, form length, pricing presentation, and offer structure. Save minor design tweaks for later optimization stages.
Frequently Asked Questions
What's the difference between link rotation and A/B testing?
Link rotation is a URL-level traffic distribution technique that automatically sends visitors to different landing pages from a single link, while A/B testing is the broader concept of comparing two or more variants to determine which performs better. Link rotation serves as the mechanism for implementing landing page A/B tests without requiring developer implementation or complex analytics setup. Traditional A/B testing tools require JavaScript installation and weeks of setup; link rotation works immediately through smart URL technology.
How much traffic do I need for link rotation to be effective?
For statistically significant results at 95% confidence with a 5% margin of error, you need approximately 1,500-3,000 visitors per variant depending on your baseline conversion rate. If you convert at 10%, you need about 2,300 visitors per variant. With lower traffic, use weighted distribution (70/30 or 80/20) to gather data while minimizing risk. Even with limited traffic (100-200 visits/week), link rotation remains valuable for gradual winner identification over longer time periods.
Can I change rotation settings after distributing the link?
Yes — this is link rotation's core advantage over traditional A/B testing. Since rotation operates at the smart link level, you can update traffic distribution, add new variants, remove underperformers, or shift 100% traffic to winners without changing the distributed URL. This flexibility enables real-time optimization that traditional A/B testing cannot provide.
How do I attribute conversions to specific landing page variants?
Smart link platforms automatically append variant identifiers to destination URLs (e.g., ?variant=a or ?variant=b), which get captured by tracking scripts, form tools, or payment platforms. This variant parameter flows through your conversion funnel, allowing attribution of form submissions, purchases, or bookings back to the specific landing page that drove them. Platforms like PIMMS automate this entire attribution flow without requiring manual UTM configuration.
Should I use 50/50 or weighted traffic distribution?
Use 50/50 distribution when both variants represent acceptable experiences, you have sufficient traffic (1,000+ visits/week), and you want fastest statistical significance. Use weighted distribution (70/30 or 80/20) when testing risky changes, you have limited traffic, or you're gradually rolling out new experiences. Weighted distribution minimizes downside risk while still gathering actionable data about variant performance.
How long should I run a link rotation test?
Run tests until you achieve statistical significance (typically 95% confidence) AND at least one full business cycle. For most businesses, this means 2-4 weeks minimum to account for day-of-week and week-to-week variations. E-commerce should run through full promotional cycles. B2B should account for longer sales cycles (4-8 weeks minimum). Stopping tests early produces unreliable results; stopping too late wastes opportunity.
Start Rotating Links to Optimize Conversions
Link rotation transforms static URLs into dynamic testing instruments that continuously optimize for conversions. By distributing traffic across landing page variants, tracking conversion performance, and reallocating traffic toward winners, marketers achieve 20-30% conversion improvements without technical dependencies.
Key takeaways:
- Create single smart links that automatically split traffic across multiple landing pages
- Use weighted distribution (70/30) for risk-mitigated testing with limited traffic
- Track complete conversion funnels, not just clicks or pageviews
- Test high-impact variables: headlines, value propositions, form length, social proof
- Reach statistical significance (95% confidence, 100+ conversions per variant) before declaring winners
- Continuously test new challenger variants against current winners for compounding improvements
Ready to implement link rotation for your campaigns? PIMMS provides smart link rotation with conversion tracking and revenue attribution — starting free with unlimited testing included.