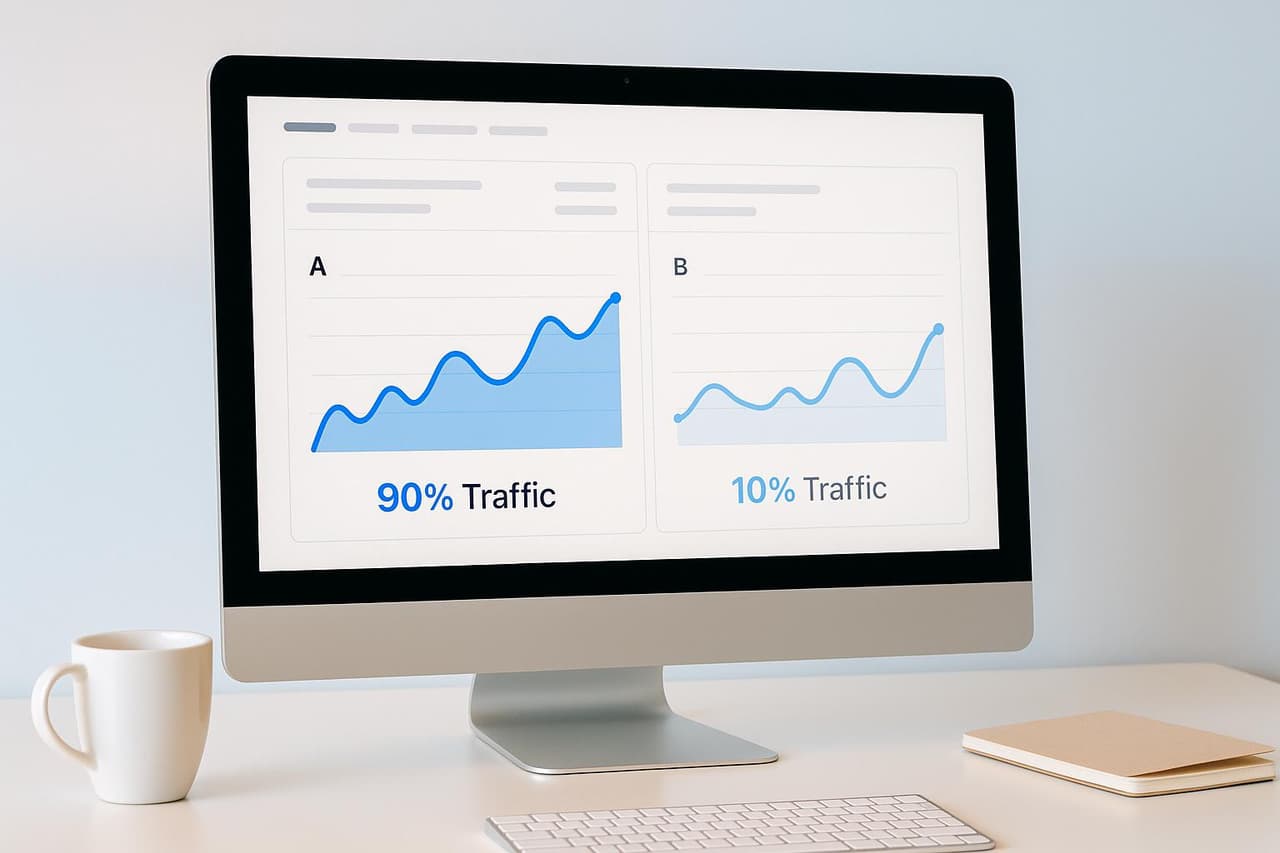
Gradual rollouts let you test changes safely by exposing only a small percentage of users to new features (e.g., 10%) while the rest (90%) stick with the original. This method minimizes risk, detects issues early, and protects your user experience. Here's why and how to use a 90/10 split:
- What it is: A gradual rollout divides users unevenly (e.g., 90% control, 10% variant) to safely test updates or features.
- Why use it: Reduces risk, limits negative impact, and ensures smooth user experiences during high-risk tests.
- When to use it: For major changes (e.g., redesigns, checkout updates) or experimental ideas where caution is key.
- How to monitor: Track key metrics like conversions and bounce rates, and adjust based on real-time data.
- Tools to help: Platforms like PIMMS simplify setup, traffic allocation, and performance tracking.
Quick Comparison: 90/10 vs. 50/50 Traffic Splits
Use gradual rollouts to test smarter, reduce risks, and make data-backed decisions before launching changes widely.
When to plan for a feature rollout or an A/B test?
How Custom Traffic Weighting Works in A/B Testing
Custom traffic weighting is a game-changer for A/B testing, allowing you to allocate user exposure beyond the typical 50/50 split. By controlling how many users see each version of your test, you can fine-tune your approach and make more informed decisions, especially during gradual rollouts.
What is Traffic Allocation?
Traffic allocation is all about deciding what percentage of users experience the control version versus the test variations in an A/B test[1]. Imagine dividing your visitors among different versions of a webpage or feature. Instead of automatically splitting traffic evenly, you can customize the percentages to align with your testing goals.
For instance, you don’t have to stick to a 50/50 split. You might opt for a 50/20/20/10 distribution when testing multiple variations simultaneously[1]. This flexibility is particularly useful when some test versions carry higher risks or require more confidence before scaling.
When to Use a 90/10 Split
A 90/10 traffic split is ideal for testing ideas that involve higher risks while minimizing the impact on most of your users. Here’s when this approach shines:
- High-risk feature testing: For significant changes like a new checkout process or a redesigned interface, a cautious rollout ensures only a small group is exposed initially.
- Early-stage experimentation: When testing unvalidated or experimental ideas, limiting exposure reduces potential fallout.
- Low-traffic websites: For sites with limited user traffic, a 50/50 split could significantly affect conversion rates, making a 90/10 split more practical.
With tools like PIMMS, setting up custom traffic splits is straightforward. You can adjust allocation based on early results, scaling up successful variants or pulling back risky ones - all without the need for complex technical adjustments.
Benefits of Gradual Rollouts for Risk Reduction
Custom traffic weighting during gradual rollouts is a smart way to reduce risk. By exposing only a small percentage of users (say, 10%) to a new feature or design, you limit the potential negative impact on your business. Here’s why this approach works so well:
- Minimized risk: If the test variation underperforms or harms key metrics, only a small portion of your audience is affected[4].
- Protected user experience: Instead of disrupting half your user base, a 90/10 split ensures any issues are confined to a smaller group, maintaining overall satisfaction.
- Preserved brand trust: Limiting exposure to buggy or confusing features prevents widespread negative experiences that could harm your reputation.
- Faster issue detection: Monitoring a smaller, controlled group allows you to identify problems within hours or days, rather than waiting for statistical significance across a larger audience.
Gradual rollouts also rely on effective monitoring tools. Platforms like PIMMS offer real-time analytics to track performance metrics immediately. This empowers you to make quick, informed decisions - whether to continue, adjust, or halt a test - without waiting for the full dataset to reach statistical significance.
Next, we’ll dive into how to set up a 90/10 gradual rollout using PIMMS.
How to Set Up a 90/10 Gradual Rollout with PIMMS
 PIMMS
PIMMS
Rolling out changes gradually is a smart way to reduce risks and gather performance data before a full-scale launch. With PIMMS, this process becomes much easier thanks to its built-in A/B testing tools and audience control features. Let’s break down how to execute a 90/10 rollout effectively.
Preparing for a Gradual Rollout
Before diving into the setup, laying the groundwork is essential to ensure your test delivers actionable insights.
Start by defining clear goals. Instead of vague aims like "improve user experience", focus on measurable outcomes such as boosting click-through rates or lowering bounce rates. This clarity helps you assess whether the changes you're testing are genuinely effective.
"A/B testing removes guesswork and bias from optimization efforts." [6]
Next, set up your control and variant experiences. The control is your current version, while the variant introduces the change you want to test. Keep it simple - test only one change at a time, like a headline, button color, or layout tweak. This way, any performance differences can be directly tied to that change.
Also, verify your analytics setup. PIMMS integrates with tools like Stripe and Shopify to track conversions and sales. Run a small test to make sure events are firing correctly and data flows seamlessly into your analytics dashboard. This step ensures your results are reliable.
Finally, schedule your test during typical business periods to avoid skewed data.
"Assumptions are dangerous when left untested. A/B testing allows you to test those assumptions and base decisions on evidence, not guesswork." – Leah Boleto, Conversion Optimization Strategist [6]
Once your goals, control, variant, and analytics are ready, you can move on to configuring the rollout.
Configuring a 90/10 Split in PIMMS
PIMMS simplifies traffic allocation with its Audience Slider tool, giving you precise control over how users are divided between the control and variant.
- Set up a new A/B test in PIMMS and configure the traffic split: 90% to control, 10% to the variant.
- Use the Audience Slider carefully. Start with an even smaller segment - perhaps just 5% of your total traffic - before scaling up. This conservative approach helps identify any issues early on.
- Configure smart links within PIMMS to ensure users are directed to the correct version based on the traffic allocation. The platform will automatically handle the distribution, ensuring users consistently see the same version throughout their session.
- Double-check your conversion tracking setup. Whether you’re tracking clicks, sign-ups, or purchases, make sure these events are properly configured before launching the test.
Keep in mind: once your test goes live, you can only increase the audience size, not decrease it [5]. So, start small and expand gradually based on the results.
Adjusting Allocations Based on Performance
One of the key advantages of gradual rollouts is the ability to adapt based on real-time data. With PIMMS, you can monitor performance closely and make adjustments as confidence in your variant grows.
During the first 24–48 hours, pay attention to key metrics like bounce rates, error reports, and user feedback. If there are any red flags, you might need to pause or revise the test.
If the variant is performing well, scale up the audience size step-by-step without altering the 90/10 split [5]. Gradual expansion ensures you maintain control while gathering more data. Avoid changing the distribution mid-test, as it can skew results. Instead, complete the current test cycle, review the findings, and set up a new test if adjustments are needed.
For faster insights, consider using dynamic traffic allocation. This feature automatically shifts more traffic to the better-performing variant while still exploring the other option [7]. It’s especially useful when you need quick results or can’t monitor the test closely. Just make sure your primary goal remains stable throughout the experiment, and that visitor demographics stay consistent [8].
Track leading indicators alongside your main metrics to guide decisions about scaling traffic before reaching full statistical significance. Keep monitoring these changes to ensure steady progress and improved outcomes.
It starts here
If you made it this far, it's time to grab 10 free links.
10 smart links included • No credit card
Monitoring and Reading Gradual Rollout Results
Tracking the performance of a 90/10 rollout is quite different from running a 50/50 test. With a smaller group exposed to the variant, it’s crucial to choose your metrics carefully.
Best Practices for Monitoring Results
Set up real-time dashboards to keep an eye on critical metrics as soon as your rollout begins. Tools like PIMMS come with built-in analytics that automatically track key performance indicators, making it easier to focus on metrics that align with your specific goals.
Your primary metrics should directly reflect your objectives. For example:
- In e-commerce, focus on revenue-related metrics like Average Order Value (AOV) and conversion rates.
- For SaaS, track sign-ups and retention rates.
- Content sites might prioritize click-through rates and session durations.
Secondary metrics, such as bounce rates, scroll depth, and user engagement patterns, can provide extra context. While they don’t directly measure success, they help explain shifts in your primary metrics.
Since your variant group is only 10% of the traffic, achieving statistical significance takes more time. Use power calculators to estimate the minimum sample size needed for reliable results. For reference, the industry median conversion rate is around 4.3% [9]. This means a 90/10 split may require running the test longer than traditional splits to reach confidence levels.
Automate alerts within PIMMS to notify you of any significant drops in key metrics. These alerts act as an early warning system, helping you catch technical issues or unexpected user behavior before they impact too many users.
Once your metrics are in place, it’s essential to address potential challenges that could distort your data.
Common Challenges and Solutions
Even with a robust monitoring setup, certain challenges can interfere with your results. One of the biggest hurdles in gradual rollouts is distinguishing between natural fluctuations and meaningful changes. Small sample sizes naturally lead to more variability, making it harder to identify genuine performance shifts.
Another common issue is Sample Ratio Mismatch (SRM), which happens when actual traffic doesn’t match the intended 90/10 split. This can undermine the validity of your results.
"SRM represents one of the most egregious data quality issues in A/B tests because it fundamentally compromises the basic assumption of random assignment... This means there is a strong possibility that any experimental results and decisions based on them will not be valid." - Stas Sajin, Michael Zhou, Krishna Gourishetti, DoorDash [10]
DoorDash tackled this problem by improving real-time tracking and automated alerts, reducing SRM incidents by 70% within six months [10].
To avoid SRM in your tests, monitor your traffic distribution daily. If deviations arise, investigate quickly - possible causes include bot traffic, caching issues, or technical glitches.
External factors like seasonality, marketing efforts, or regional events can also skew results. Keep track of these influences and adjust your analysis accordingly. Additionally, exclude the first day of testing from your calculations [2], as early anomalies or setup issues can distort your findings.
Once these challenges are addressed, you’ll be ready to decide when to scale up your variant’s traffic.
When to Scale Traffic Allocation
Gradual scaling is all about balancing risk with confidence. When deciding to increase your variant’s exposure, look for steady improvements in primary metrics and stable secondary metrics over a period of 48–72 hours. Avoid relying on one-off spikes; instead, focus on consistent trends across multiple indicators.
If your variant shows strong performance, increase traffic in small increments - 5–10% at a time - rather than jumping straight to a 50/50 split [2]. This cautious approach allows you to spot potential issues that might only emerge at higher traffic volumes while still speeding up data collection.
"We recommend keeping the same traffic allocation throughout the campaign duration." - AB Tasty [11]
If your findings suggest significant changes are needed, it’s better to start a new test rather than altering the current one mid-stream. This ensures your results remain reliable and easy to interpret.
For those looking for a more dynamic approach, PIMMS offers dynamic traffic allocation, which automatically shifts more traffic to the better-performing variant while still testing the less successful option [7]. Typically, this strategy reserves 10% of traffic for exploration while directing the remaining 90% to the current leader [1]. This method works well when quick results are needed or when showing the weaker variant comes with higher costs, such as in short-term campaigns.
To finalize decisions, wait at least two weeks after the test concludes [2]. Use your PIMMS dashboard to evaluate the long-term impact of your changes. Metrics like user retention and lifetime value often take time to stabilize, so initial positive results might not always hold up over the longer term.
90/10 vs. 50/50 Traffic Splits Comparison
Deciding between a 90/10 or 50/50 traffic split depends on your testing goals and how much risk you're willing to take. Each method has its own strengths and trade-offs, which can significantly shape your testing outcomes. Below, we break down the key differences to help you choose the best approach for your needs.
Pros and Cons of 90/10 vs. 50/50 Splits
Each traffic allocation method has distinct advantages and challenges. Here’s a side-by-side comparison to clarify their impact:
This comparison highlights the scenarios where each split works best. Let’s dive deeper into when to use each strategy.
When to Use Each Approach
Your choice of traffic split should align with the nature of the test and the level of risk involved.
90/10 Split:
A 90/10 split is the go-to choice when minimizing risk is crucial. Consider this method if you are:
- Testing major design overhauls or entirely new user experiences.
- Launching price changes that could significantly impact revenue.
- Introducing features that might affect server performance or load capacity.
- Working on high-stakes products where protecting the current user experience is critical.
- Releasing new updates quickly while keeping potential disruptions to a minimum.
50/50 Split:
The 50/50 split is better suited for lower-risk scenarios where quick results are a priority. Use this approach if you are:
- Making small adjustments, such as tweaking copy, button colors, or layouts.
- Running optimization tests on existing features.
- Seeking statistically significant results in a shorter time frame.
- Comfortable with exposing half of your audience to the new variation, given the low risk of adverse effects.
Avoiding Biases in Uneven Splits
Uneven splits, like 90/10 allocations, can introduce challenges such as higher variability in results. To ensure reliable outcomes, follow these best practices:
- Extend Your Testing Period: Expect tests with a 90/10 split to take longer to reach statistical significance compared to 50/50 splits. Be patient and allow ample time for data collection.
- Monitor for Selection Bias: Verify that the traffic split remains consistent throughout the test. Real-time monitoring can help catch discrepancies early.
- Account for Temporal Effects: Run tests over full weekly cycles to minimize the impact of day-of-week or seasonal trends that could skew results.
- Set Proper Significance Thresholds: Adjust confidence levels to account for the smaller test group. Validate initial findings with additional testing before rolling out changes widely.
- Gradual Ramp-Up: Once initial results are favorable, slowly increase the test group’s traffic in 5–10% increments. This step-by-step approach helps identify any issues that might emerge at higher traffic levels.
Conclusion
Gradual rollouts with a 90/10 traffic split offer a smarter, safer way to test changes compared to traditional A/B testing methods.
Key Takeaways
Using custom traffic allocation minimizes risk while still delivering useful performance data. Instead of exposing half your audience to untested changes, a 90/10 split shields 90% of your users while gathering insights from the remaining 10%. This makes it especially effective for testing significant updates like design overhauls, pricing adjustments, or new features.
PIMMS simplifies this process by providing built-in A/B testing tools with customizable traffic allocation. Its real-time analytics let you monitor results instantly, so you can make adjustments as needed without delay.
Businesses adopting gradual rollouts have reported conversion increases of 45% to 112%, all while maintaining a seamless user experience [3]. By leveraging these methods, you can run controlled experiments that safeguard your core metrics.
Test Smarter, Not Riskier
Your next experiment doesn't have to be a gamble. Gradual rollouts help you identify potential problems early, collect valuable user feedback, and make informed choices before scaling changes.
When it comes to optimizing your site or product, data-driven decisions are always the better option. Whether you're tweaking a call-to-action button or launching a major redesign, this approach gives you the confidence to innovate without compromising your current user experience.
With PIMMS' custom traffic allocation features, you can start implementing these strategies today. Plus, integrations with platforms like Stripe and Shopify let you track not just clicks and conversions but also the revenue impact of your tests - giving you a complete view of how your experiments influence your bottom line.
FAQs
What are the benefits of using a 90/10 traffic split in A/B testing instead of a 50/50 split?
When using a 90/10 traffic split in A/B testing, you reduce the risk by keeping most of your audience on the stable, proven version. With 90% of your traffic directed to the control group, the majority of users continue to experience the familiar option, minimizing any potential disruptions or negative effects on their experience.
On the other hand, a 50/50 split divides traffic equally between the control and test versions. While this can speed up data collection, it also increases the chances of widespread issues if the test version doesn't perform well. By sticking to a 90/10 split, you can experiment with new ideas on a smaller group, gathering useful insights while protecting the overall user experience.
What metrics should I track during a 90/10 gradual rollout to ensure the new feature is successful?
During a 90/10 gradual rollout, keeping a close eye on key metrics is essential to gauge the performance and impact of the new feature. Here are the main areas to focus on:
- Conversion rates: Assess how effectively the feature encourages actions like purchases, sign-ups, or any other goal-specific outcomes.
- User engagement: Look at metrics such as time spent on the page, click-through rates, or how often the feature is being used to understand user interaction.
- Error rates: Monitor for any technical glitches or issues that could negatively affect the user experience.
On top of that, feedback from early adopters can provide helpful insights into the feature’s usability and overall satisfaction. By analyzing these metrics and feedback, you can pinpoint areas for improvement and fine-tune the experience before expanding the rollout further.
How do I safely adjust traffic allocation during a gradual rollout to optimize results?
To adjust traffic allocation safely during a gradual rollout, start with an uneven traffic split. For instance, you might send 90% of traffic to the control group (the established version) and just 10% to the new variant. This strategy helps reduce risks by ensuring that most users interact with the reliable version, while still collecting valuable data on the new option's performance.
As the results come in, you can gradually shift more traffic to the variant that performs better. This method strikes a balance between exploration - testing new ideas - and exploitation - making the most of what already works. By carefully tweaking traffic distribution based on actual performance, you can fine-tune your rollout, safeguard the user experience, and minimize potential risks.