What is Campaign Cost Attribution?
Campaign cost attribution is the practice of mapping marketing expenses to specific campaigns, channels, and conversion events — enabling precise calculation of return on investment (ROI) by connecting ad spend, content production costs, and tool expenses to the revenue they generate. Unlike basic revenue tracking that shows "this campaign made $10,000," cost attribution reveals "this campaign spent $3,200 and generated $10,000 for a 212% ROI," transforming marketing from a cost center into a measurable profit driver.
According to Gartner's 2025 Marketing Attribution Survey of 740 marketing leaders, only 23% track complete cost-to-revenue attribution across all channels, yet those who do report 34% higher marketing efficiency and 2.1x faster budget allocation decisions.
Why Cost Attribution Transforms Marketing Performance
You can't optimize what you don't measure. Most marketers track revenue but overlook the cost side of the ROI equation, leading to misallocated budgets and hidden money drains.
The Cost Visibility Problem
Traditional analytics platforms create three critical blind spots:
- Revenue without cost context — Knowing a campaign generated $50,000 revenue means nothing without the $40,000 spend that produced it
- Channel-level aggregation — Seeing "Facebook Ads spent $12,000" doesn't reveal which specific campaigns, audiences, or creatives drove positive ROI
- Missing organic costs — Content marketing, SEO, and social media have real costs (time, tools, freelancers) that vanish from ROI calculations
Self-contained answer: Campaign cost attribution solves these problems by assigning specific costs to individual campaigns and mapping those costs to conversion events, creating complete profit-and-loss visibility for every marketing initiative. This enables marketers to double down on profitable campaigns, kill money-losing efforts, and accurately forecast returns from budget increases.
Real-World Impact Data
According to Forrester's 2025 Marketing Operations Benchmark analyzing 1,840 companies:
The data shows that campaign-level cost tracking eliminates 25% of wasted marketing spend and enables 4x faster optimization cycles.
How to Implement Campaign Cost Attribution: Step-by-Step
Step 1: Centralize All Marketing Costs
Create a single source of truth for every marketing expense.
Cost categories to track:
Centralization tools:
- Spreadsheets: Start here for simplicity (Google Sheets or Excel with monthly cost entries)
- Accounting software: QuickBooks, Xero with marketing expense categories
- Marketing dashboards: Supermetrics, Windsor.ai, or Funnel.io for automated cost aggregation
- All-in-one platforms: PIMMS, HubSpot, or Salesforce with cost tracking modules
Step 2: Map Costs to Campaigns with UTM Parameters
Connect spend to specific campaigns using consistent tagging.
UTM-based cost mapping structure:
Campaign: Spring Product Launch 2026
Ad Platform: Facebook Ads
Budget: $5,000
UTM Parameters:
  utm_source=facebook
  utm_medium=paid
  utm_campaign=spring-product-launch-2026
  utm_content=video-ad-variant-a

Cost assignment: $5,000 → spring-product-launch-2026
Revenue tracking: All conversions with matching UTMs
ROI calculation: (Revenue - $5,000) / $5,000 × 100
Automated cost import from ad platforms:
Most ad platforms (Google Ads, Facebook Ads, LinkedIn Campaign Manager) offer API access to pull daily spend data automatically. Integration tools like Supermetrics or Zapier connect ad platform spend to analytics dashboards, eliminating manual entry.
For comprehensive UTM strategies, see our UTM tagging system guide.
Step 3: Track Conversions with Revenue Values
Attribute both the conversion event AND its monetary value to campaigns.
Conversion value tracking methods:
E-commerce (immediate value):
Event: Purchase completed
Campaign: utm_campaign=black-friday-2026
Cost: $1,200 ad spend
Revenue: $8,450 (47 orders)
Profit: $8,450 - $1,200 - ($8,450 × 0.3 COGS) = $4,715
ROI: 392%
Lead generation (estimated value):
Event: Form submission
Campaign: utm_campaign=webinar-q1-2026
Cost: $800 (ads + tool costs)
Conversions: 34 leads
Lead value: $350 (based on historical close rate × average deal size)
Estimated revenue: 34 × $350 = $11,900
Estimated ROI: 1,388%
SaaS subscription (lifetime value):
Event: Trial signup → paid conversion
Campaign: utm_campaign=content-marketing-seo
Cost: $2,400 (content production + promotion)
Conversions: 12 paid customers
LTV per customer: $2,800 (avg 18-month retention)
Total LTV: 12 × $2,800 = $33,600
LTV:CAC ratio: 14:1 (healthy)
Connect payment platforms (Stripe, Shopify, PayPal) to automatically capture transaction values. For detailed implementation, see our guide on tracking Stripe sales with UTM parameters.
Step 4: Calculate ROI at Campaign and Channel Levels
Transform cost and revenue data into actionable ROI metrics.
Essential ROI formulas:
Simple ROI:
ROI = ((Revenue - Cost) / Cost) × 100

Example:
Revenue: $15,000
Cost: $4,000
ROI = (($15,000 - $4,000) / $4,000) × 100 = 275%

Interpretation: For every $1 spent, you earned $2.75 in profit
Return on Ad Spend (ROAS):
ROAS = Revenue / Ad Spend

Example:
Revenue: $28,000
Ad Spend: $7,000
ROAS = $28,000 / $7,000 = 4:1

Interpretation: For every $1 in ad spend, you generated $4 in revenue
Customer Acquisition Cost (CAC):
CAC = Total Marketing Cost / Number of New Customers

Example:
Marketing Cost: $12,000
New Customers: 48
CAC = $12,000 / 48 = $250 per customer
CAC Payback Period:
Payback Period = CAC / (Monthly Revenue per Customer - Monthly Cost to Serve)

Example:
CAC: $250
Monthly subscription: $49
Monthly cost to serve: $12
Payback = $250 / ($49 - $12) = 6.76 months
According to ProfitWell's 2025 SaaS Metrics Report, top-performing SaaS companies maintain CAC payback periods under 12 months and LTV
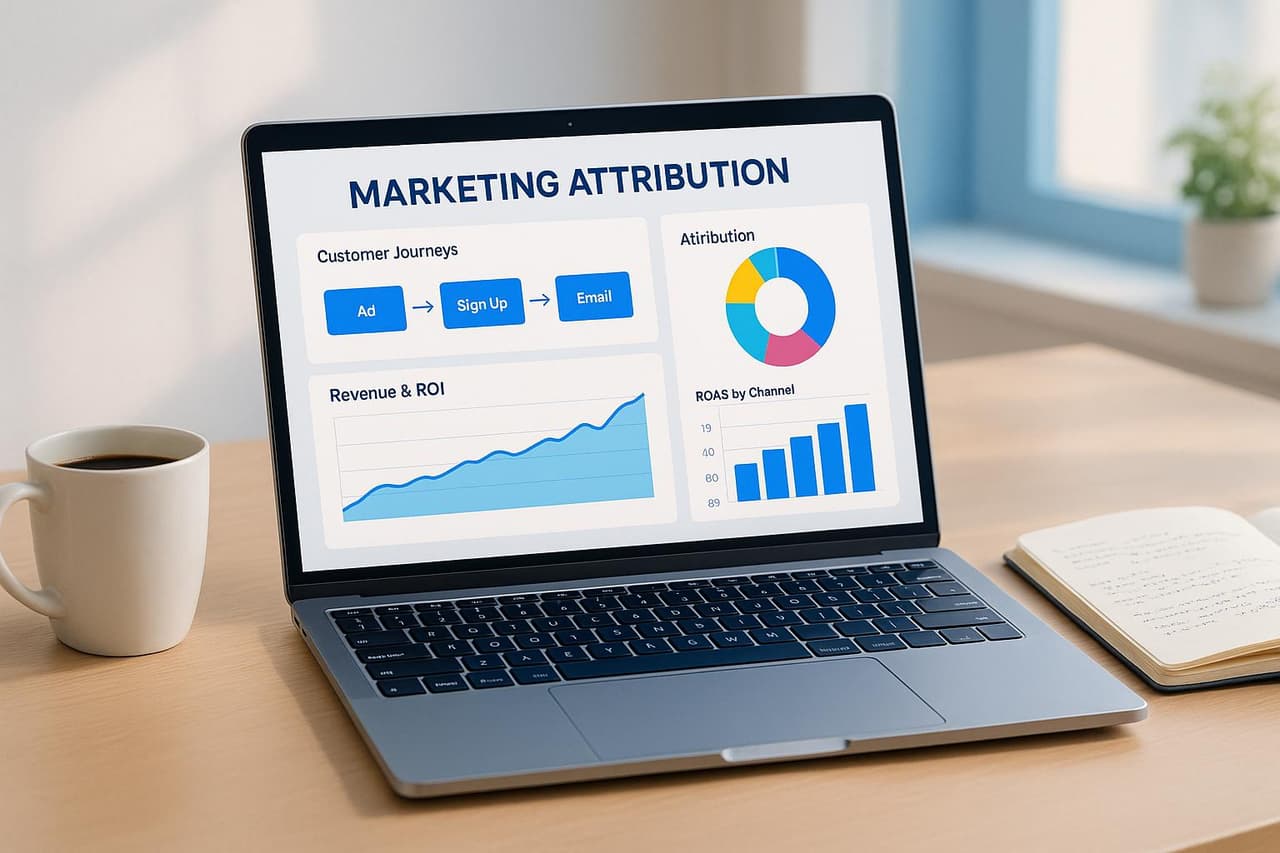
ratios above 3.Step 5: Build Multi-Touch Attribution Models
Assign cost credit across the entire customer journey, not just the last touchpoint.
Attribution model comparison:
Multi-touch cost attribution example:
Customer journey:
1. First touch: Blog post (organic search) — Cost: $150 (content production allocated)
2. Second touch: Email campaign — Cost: $8 (email platform cost per recipient)
3. Third touch: Retargeting ad — Cost: $12 (Facebook Ads)
4. Conversion: $1,200 purchase

Position-based attribution (40/20/40):
- Blog post receives: 40% × ($150 + $8 + $12) = $68 allocated cost
- Email receives: 20% × $170 = $34 allocated cost
- Retargeting receives: 40% × $170 = $68 allocated cost

ROI by touchpoint:
- Blog: ($1,200 - $68) / $68 = 1,665% ROI
- Email: ($1,200 - $34) / $34 = 3,429% ROI (but wouldn't convert alone)
- Retargeting: ($1,200 - $68) / $68 = 1,665% ROI
For comprehensive attribution strategies, see our complete guide to marketing attribution.
Best Practices for Accurate Cost Attribution
Allocate Costs to the Correct Time Periods
Match expenses to the period when results occur, not when money was spent.
Time-based cost allocation strategies:
Monthly allocation (most common):
January Facebook Ads: $8,000
January conversions: 124
January revenue: $34,200
January ROI: 327%

Use for: Paid ads, email campaigns, short sales cycles
Quarterly allocation (content marketing):
Q1 content production: $12,000 (10 blog posts, 3 guides)
Q1-Q2 conversions attributed to content: 287
Q1-Q2 revenue from content: $94,500
6-month ROI: 688%

Use for: SEO content, long-tail organic efforts
Project-based allocation (launches):
Product launch campaign (Jan 15 - Feb 28):
- Pre-launch content: $4,200
- Launch ads: $9,800
- Email sequences: $1,400
- Total: $15,400

Launch-period conversions: 213
Launch revenue: $67,300
Launch ROI: 337%

Use for: Product launches, seasonal campaigns, events
Track Organic and Owned Channel Costs
Free channels aren't free — they have real costs that affect ROI calculations.
Hidden costs to track:
Example: SEO content cost attribution
Blog article: "Complete Guide to Email Marketing"
Costs:
- Writer (2,000 words × $0.15): $300
- Editor (2 hours × $50): $100
- Designer (custom graphics): $75
- Total: $475

Performance (12 months):
- Organic sessions: 8,450
- Conversions: 47
- Revenue: $18,200
- ROI: 3,732%

Without cost tracking, this appears "free organic traffic"
With cost tracking, you see an exceptional investment
Segment by Customer Acquisition vs. Retention
Acquisition and retention campaigns have different cost structures and ROI expectations.
Cost segmentation framework:
According to Bain & Company research, acquiring new customers costs 5-25x more than retaining existing ones, but acquisition metrics often look worse because this reality isn't accounted for in basic ROI calculations.
Factor in Incrementality and Attribution Windows
Not all attributed revenue would have disappeared without the campaign.
Incrementality testing:
Test: Facebook retargeting campaign
Duration: 4 weeks
Control group: 50% of retargeting audience (no ads shown)
Test group: 50% of retargeting audience (ads shown)

Results:
Control group conversions: 12.3%
Test group conversions: 17.8%
Incremental lift: 5.5 percentage points

Incremental revenue calculation:
Total test group revenue: $45,000
Subtract baseline (what would have happened anyway):
  $45,000 × (12.3% / 17.8%) = $31,123 baseline
Incremental revenue: $45,000 - $31,123 = $13,877

True ROI calculation:
Campaign cost: $4,800
Incremental revenue: $13,877
True ROI: 189% (not the 838% from naive attribution)
This approach, used by companies like Google and Facebook for their own marketing, prevents overestimating campaign impact.
Use Attribution Windows Appropriate to Sales Cycles
Different products have different purchase timelines that affect cost-to-revenue mapping.
Attribution window recommendations:
Impact on cost attribution:
Example: Enterprise SaaS with 90-day sales cycle

January marketing cost: $15,000
January conversions: 3 customers
January revenue: $18,000
Naive ROI: 20%

BUT — those January customers were influenced by campaigns from:
- October (first touch): blog content
- November (nurture): webinar
- December (consideration): demo + retargeting
- January (close): sales follow-up + case study

True cost attribution across full journey: $8,500
True ROI: 112%
Advanced Cost Attribution Techniques
Profit-Based Attribution (Not Just Revenue)
Track profit margins to reveal true ROI beyond topline revenue.
Profit attribution formula:
Gross Profit = Revenue - Cost of Goods Sold (COGS) - Marketing Cost

Example campaign:
Revenue: $50,000
COGS (30%): $15,000
Marketing cost: $8,000
Gross profit: $50,000 - $15,000 - $8,000 = $27,000
Profit margin: 54%
ROI based on profit: 337%
Why this matters:
Two campaigns might have identical revenue but vastly different profitability:
Revenue ROI appears identical (525%), but profit ROI reveals Campaign A is 4.5x more profitable than Campaign B.
Cohort-Based Cost Tracking
Analyze how customer acquisition costs and LTV evolve over time.
Cohort cost attribution structure:
January 2026 Acquisition Cohort:
- Marketing cost: $12,000
- Customers acquired: 48
- CAC: $250

Cohort revenue over time:
- Month 1: $2,880 (48 × $60 avg)
- Month 6: $2,640 (44 retained × $60)
- Month 12: $2,280 (38 retained × $60)

Cumulative metrics:
- CAC payback: Month 5
- 12-month LTV: $702 per customer
- LTV:CAC ratio: 2.8:1
- 12-month ROI: 180%
Track multiple cohorts to identify trends:
Cohorts by acquisition channel:
Q1 organic cohort: LTV $850, CAC $180, ratio 4.7:1
Q1 paid social cohort: LTV $680, CAC $320, ratio 2.1:1
Q1 referral cohort: LTV $920, CAC $95, ratio 9.7:1

Action: Increase referral program budget
Cost Attribution for Content Marketing
Allocate content production costs across the lifetime of content assets.
Content cost amortization:
Comprehensive guide: "The Complete Email Marketing Playbook"
Production costs:
- Research: 8 hours × $75 = $600
- Writing: 12 hours × $80 = $960
- Design: 6 hours × $70 = $420
- Editing: 3 hours × $60 = $180
- Total: $2,160

Performance over 24 months:
- Month 1-6: 340 conversions, $112,000 revenue
- Month 7-12: 520 conversions, $184,000 revenue
- Month 13-18: 410 conversions, $158,000 revenue
- Month 19-24: 280 conversions, $103,000 revenue
Total: 1,550 conversions, $557,000 revenue

Cost per conversion: $2,160 / 1,550 = $1.39
ROI over 24 months: 25,694%
This long-tail attribution reveals why content marketing appears expensive upfront but delivers exceptional ROI over time.
API-Driven Automated Cost Tracking
Eliminate manual cost entry by integrating ad platform APIs directly into attribution dashboards.
Automated cost import workflow:
Daily at 6:00 AM:
1. Pull Google Ads spend by campaign (yesterday)
2. Pull Facebook Ads spend by ad set (yesterday)
3. Pull LinkedIn Campaign Manager spend (yesterday)
4. Import to central dashboard
5. Map costs to UTM campaigns via naming conventions
6. Calculate ROI with conversion data from analytics
7. Send daily performance summary email
Tools for automated cost import:
- Supermetrics — Connects 100+ marketing platforms to Google Sheets, Data Studio, BigQuery
- Windsor.ai — Marketing attribution with automated cost imports
- Funnel.io — Marketing data hub with cost tracking
- Zapier/Make — Custom integrations between ad platforms and spreadsheets
- PIMMS — Tracks costs and revenue in one platform for complete attribution
According to Marketing Operations Association's 2025 survey, marketers using automated cost import save 8-12 hours per week on manual reporting.
Campaign Cost Attribution Tools and Platforms
Essential Platform Features
Evaluate cost attribution tools based on these capabilities:
PIMMS: Complete Cost-to-Revenue Attribution
PIMMS provides end-to-end marketing ROI tracking:
- Automated cost tracking from ad platforms and manual campaign entry
- UTM-based campaign mapping connecting spend to conversions
- Revenue attribution via Stripe, Shopify, and payment integrations
- Multi-touch attribution models (first-touch, last-touch, linear, time-decay, position-based)
- ROI dashboards showing profitability by campaign, channel, and time period
- Lead scoring with cost-per-lead calculations
- Form and calendar integration for lead-generation cost tracking
- Smart links with conversion tracking for complete funnel visibility
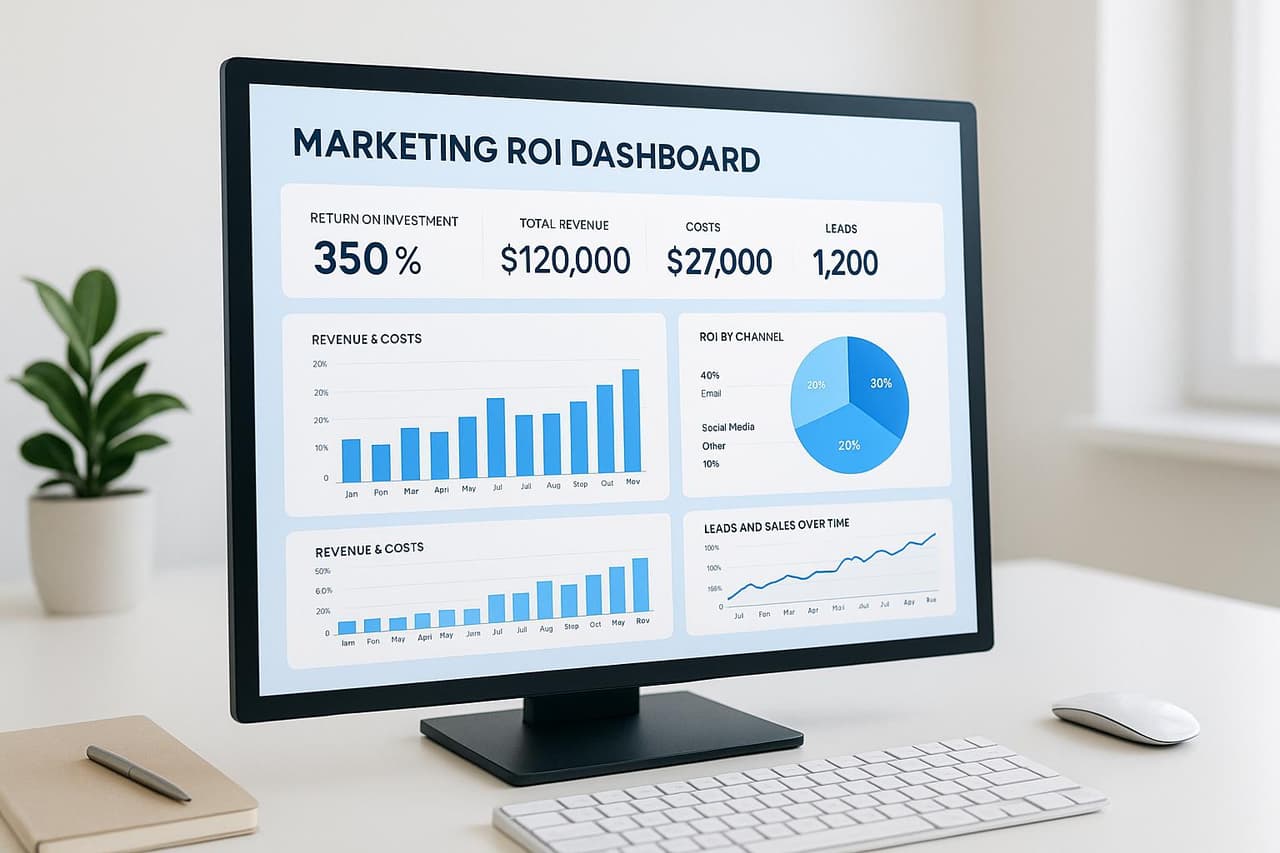
Unlike standalone analytics tools that track revenue OR costs, PIMMS unifies both sides of the ROI equation for complete marketing profitability insights. For dashboard building, see our guide on building ROI dashboards.
Common Cost Attribution Mistakes to Avoid
Mistake 1: Tracking Revenue Without Costs
Problem: Celebrating campaigns that generated high revenue but cost more than they earned.
Solution: Always calculate ROI, not just revenue. A campaign generating $100,000 in revenue with $120,000 in costs is a failure, not a success.
Mistake 2: Ignoring Overhead and Tool Costs
Problem: Only tracking ad spend while ignoring email platform subscriptions, CRM costs, design tools, and salaries.
Solution: Allocate all marketing expenses to campaigns. If your email platform costs $500/month and you send 10 campaigns, allocate $50 per campaign plus variable send costs.
Mistake 3: Using Single-Touch Attribution for Multi-Touch Journeys
Problem: Giving 100% cost credit to the last click undervalues awareness and consideration campaigns.
Solution: Implement multi-touch attribution models (position-based or time-decay) for accurate cost allocation across the customer journey. See our multi-touch attribution comparison.
Mistake 4: Not Accounting for Sales Cycle Length
Problem: Judging January's campaign performance based on January's revenue when your sales cycle is 90 days.
Solution: Use attribution windows that match your typical sales cycle. Enterprise B2B should look at 90-180 day windows; impulse e-commerce can use 1-7 days.
Mistake 5: Comparing Acquisition and Retention ROI Directly
Problem: Killing acquisition campaigns because they have "worse ROI" than retention campaigns.
Solution: Segment acquisition vs. retention metrics. Acquisition inherently costs more but builds customer base; retention costs less but depends on acquisition feeding it.
Frequently Asked Questions
What's a good marketing ROI benchmark?
Marketing ROI varies significantly by industry, business model, and campaign type. According to Nielsen's 2025 Marketing ROI Report, median ROI is 200-250% (earning $2-2.50 for every $1 spent). High-performing campaigns achieve 400-600% ROI. Early-stage startups investing in brand awareness may accept 100-150% ROI, while mature companies optimizing performance campaigns target 300-500%. SaaS companies should aim for LTV
ratios above 3 with CAC payback under 12 months.How do I calculate ROI for brand awareness campaigns?
Brand awareness campaigns generate long-term value that's difficult to track immediately. Use these approaches: (1) Proxy metrics like brand search volume increases, (2) Incrementality testing with control groups to isolate awareness campaign impact, (3) Extended attribution windows (90-180 days) to capture delayed conversions, (4) Survey-based brand lift studies measuring awareness and consideration changes. Assign estimated value to awareness metrics based on historical conversion rates from aware to purchased.
Should I track costs by campaign or by channel?
Track both. Channel-level costs show "we spend $50,000/month on Facebook Ads," while campaign-level costs reveal "Product Launch Campaign spent $8,000 with 325% ROI while Awareness Campaign spent $12,000 with 95% ROI." Channel aggregation hides winners and losers; campaign granularity enables optimization. Use UTM parameters to map channel spend to specific campaigns automatically.
How do I attribute costs when customers touch multiple campaigns?
Use multi-touch attribution models to distribute costs across the customer journey. Position-based attribution assigns 40% cost to first touch, 40% to last touch, and 20% to middle touches. Time-decay attribution gives more cost credit to recent touches. Linear attribution divides costs equally. Choose models based on your business: position-based for balanced view, time-decay for sales-focused teams, first-touch for awareness measurement.
What's the difference between ROI and ROAS?
ROI (Return on Investment) measures profit as a percentage: ROI = ((Revenue - Cost) / Cost) × 100. ROAS (Return on Ad Spend) measures revenue as a ratio: ROAS = Revenue / Cost. Example: $10,000 revenue from $2,000 spend = 400% ROI or 5
ROAS. ROI shows profitability percentage; ROAS shows revenue multiple. Use ROI for profitability decisions and ROAS for revenue-focused performance marketing where profit margins are consistent.How often should I review campaign cost attribution?
Review frequency depends on spend level and campaign duration. Daily reviews for high-spend campaigns ($1,000+/day) or short campaigns (1-2 weeks). Weekly reviews for medium-spend campaigns ($500-1,000/day) or ongoing campaigns. Monthly reviews for low-spend campaigns (<$500/day) or long-cycle campaigns (B2B, enterprise). Always review immediately after campaign completion and again at your full attribution window (e.g., 30 days post-campaign for 30-day sales cycles).
Start Tracking True Marketing ROI Today
Campaign cost attribution transforms marketing from subjective opinions into objective profit-and-loss analysis. By tracking all marketing expenses, mapping costs to campaigns via UTM parameters, connecting spend to revenue outcomes, and calculating ROI at campaign and channel levels, you eliminate wasted spend and confidently scale what works.
Key takeaways:
- Track ALL marketing costs: paid ads, content production, tools, salaries, and overhead
- Map costs to campaigns using consistent UTM parameters for automated attribution
- Connect conversions to revenue through payment platform integrations (Stripe, Shopify)
- Calculate ROI, ROAS, CAC, and LTV ratios to measure true profitability
- Use multi-touch attribution for accurate cost allocation across customer journeys
- Segment acquisition vs. retention campaigns — they have different cost structures
- Review campaign ROI regularly and reallocate budget toward highest-performing initiatives
Ready to track complete marketing ROI with automated cost attribution? PIMMS connects marketing spend to revenue outcomes across all channels — starting free with conversion tracking and revenue attribution included.